
The Earth has been warming. And, many Americans are persuaded that global warming is caused by fossil fuel emissions that will lead to dire consequences for our wealth and safety. Climate activists and green energy advocates insist that the cost of increasing fossil fuel emissions will far exceed the cost of replacing fossil-fueled energy with green (non-carbon-emitting) energy. This brief examines that claim and finds that there is little evidence to support it.
This brief also reveals that scientists have repeatedly demonstrated that the Earth’s greenhouse warming effect is saturated. Even if the atmospheric concentration of greenhouse gases doubles, replacing all fossil energy in the US with green energy will only prevent a minor increase in global warming. Moreover, if we abandon fossil fuels, fossil-fueled electric generation will no longer be able to back up unreliable wind and solar generation as fossil-fueled generation does now. Unfortunately, without backup for unreliable wind and solar generation, US electric grids will eventually collapse, unable to produce electricity. Even worse, electric utilities won’t be able to replace fossil generation with electric storage batteries to back up wind and solar, because the cost to consumers and businesses will be unbearable.
The revelations summarized above may be unfamiliar, but they are true and well-proven. This brief reports and explains the revelations as well as the supporting scientific, technological, and economic evidence. The science cited is explained in plain language for non-scientists.
The UN’s Warming and Climate Predictions
The UN’s influential Intergovernmental Panel on Climate Change (IPCC) is tasked by the UN with periodically assessing the results of scientific publications and climate modeling. The UN IPCC’s 42-page Summary for Policymakers (Masson-Delmotte, V. et al 2021) and the companion 85-page Longer Report (Hoesung Lee, et al 2023) are contained within the UN’s Climate Change 2023: Synthesis Report. Contribution of Working Groups I, II and III as a part of the UN IPCC’s Sixth Assessment Report (AR6). The Summary for Policy Makers (SPM) and the companion Longer Report summarize the UN IPCC’s assessment of climate science in plain language to advise interested non-scientists. The UN reports are considered by many to be the most trustworthy global warming and climate predictions. The claims and predictions in the reports are sometimes cited by government officials, scholars, and journalists.
The UN’s SPM warns that “Climate change is a threat to human well-being and planetary health (very high confidence).” The report attributes past and future global warming to increases in human-caused emissions of greenhouse gases[1] (GHGs), especially carbon dioxide (CO2) and methane (CH4) – and primarily from the use of fossil fuels[2] but also from the use of land (primarily agriculture). The Longer Report predicts (page 33) that Earth’s average temperature will increase by 3.2°C from 1850 -1900 until 2100.[3] That implies a 2.1°C rise from 2020 until 2100 [4] under a GHG global emissions scenario that the UN IPCC believes to be a continuation of policies globally implemented by 2020. If CO2 concentration doubles by 2100, the UN predictions are 0.4°C higher – 3.6°C and 2.5°C respectively.
Surprisingly, neither the SPM nor the Longer Report confirm predictions to readers with scientific evidence. It appears that the claims and colorful charts in the two reports are based on climate models. The theories and methods that support the models, including the results of tests demonstrating the validity of the models, might have been explained. Yet, no explanations or test results are provided in these reports. Fortunately, two distinguished climate scientists have independently tested the UN climate models and reported their findings which are reported below.
A Test of the UN’s Climate Models
About 40 modeling groups around the world created and submitted climate models to the UN IPCC. Their Coupled Model Intercomparison Project is primarily sponsored by other UN organizations and the US Department of Energy. The set of models submitted to the UN IPCC for the most recent UN reports has been designated CMIP6. The UN IPCC reports indicate that the UN IPCC used the CMIP6 climate models to arrive at the UN’s global temperature and climate change predictions.
Dr. John Christy,[5] Director of the Earth System Science Center at the University of Alabama in Huntsville (UAH), and his UAH colleague, Principal Research Scientist Dr. Roy Spencer,[6] compared the temperatures predicted by the CMIP6 climate models to observed temperatures over the past four decades. Dr. Christy charted the CMIP6 predictions and the observed temperature anomalies that were presented in a recorded lecture, Testing Climate Claims – Update (Christy 2021). A chart from the lecture is duplicated in Figure 1. The four historical decades charted coincide with the era of accurate global temperature measurements by the Earth satellites launched and monitored by the National Oceanic and Atmospheric Administration (NOAA) and NASA. Temperature anomalies refer to the changes in temperature relative to a reference temperature. In this chart, the reference temperature is Earth’s mean global temperature from 1975 through 1979, when satellite measurements of Earth’s temperatures first became available.
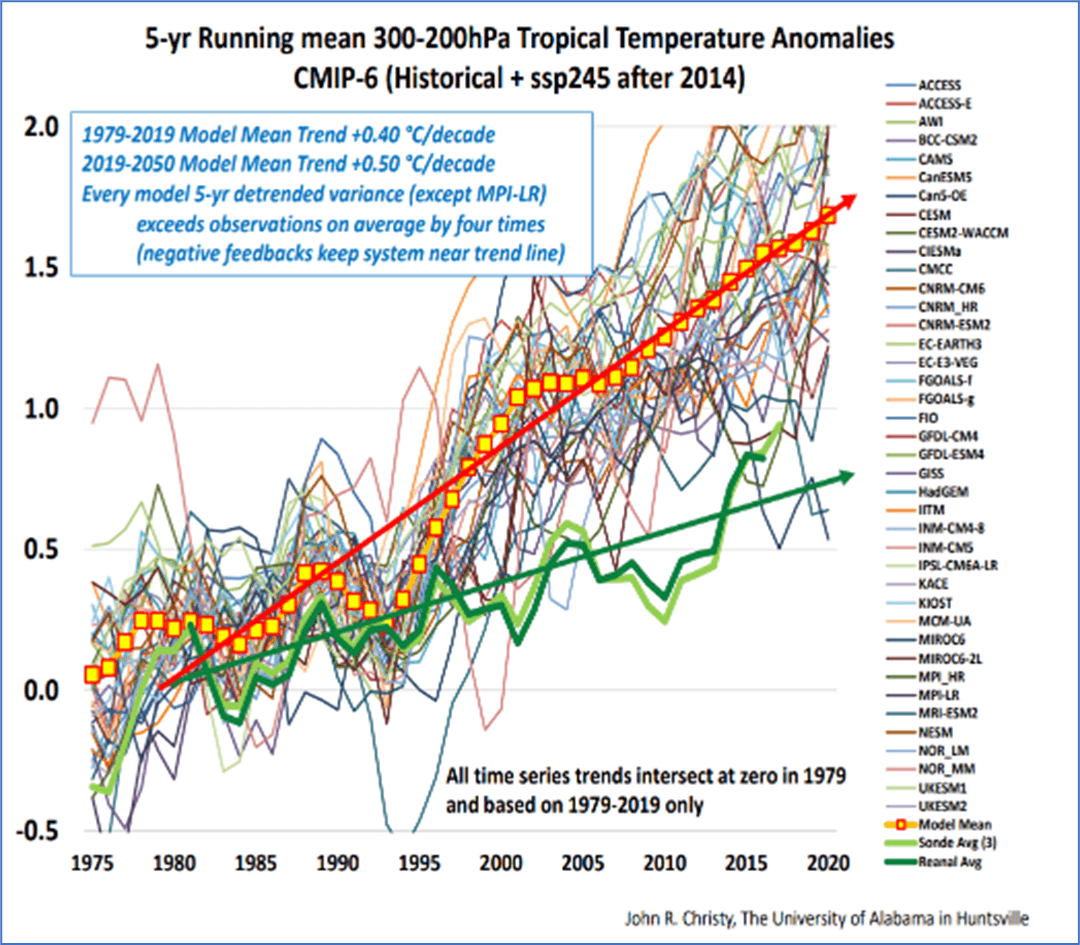
Figure 1. CMIP6 temperature anomaly predictions vs. observations.
During the past four decades, the observed mean global temperature anomaly trend was about 0.16°C per decade, while the predicted anomaly trend of the average of the CMIP6 models during that period was about 0.40°C per decade. The obvious lack of statistical correlation between model results and observations, as depicted in Figure 1, disproves the CMIP6 models and their predictions.
Professor and Nobel physicist, Dr. Richard Feynman,[7] taught that the scientific method requires scientists to use their scientific guesses (hypotheses) to make a prediction that can be compared to scientific observation. Dr. Feynman emphasized that if the prediction fails to match observations, then the guesses (hypotheses) supporting the prediction are wrong.[8]
The UN IPCC is undoubtedly aware of the scientific method and the failure of the UN model predictions to match reality over four decades but did not explain or dispute the failure in its reports. So, let’s examine what scientists can realistically predict about future global temperatures.
The Greenhouse Effect
Predictions of global warming are usually explained to be a result of the greenhouse effect, which is caused by GHGs in Earth’s atmosphere. The greenhouse effect functions as follows.
As readers may have learned in high school science, radiation transfers heat energy through the Earth’s atmosphere. Solar radiation (aka sunshine) passes through Earth’s atmosphere to warm the Earth. The warmed Earth radiates infrared heat energy back through the atmosphere toward outer space. This infrared radiation cools the Earth in the same manner that infrared radiation invariably cools a cup of hot coffee. However, GHGs in the Earth’s atmosphere intercept and absorb some of Earth’s radiated energy. The GHGs react to the radiant energy absorption by radiating absorbed energy outward in all directions, including toward Earth. This reduces the flux (or power) of radiant energy escaping to outer space, thus hindering Earth’s radiant cooling sufficiently to support life on Earth. The net effect of the opposing radiant energy transfer establishes Earth’s equilibrium temperature when incoming and outgoing energy is balanced.
In summary, an incremental reduction in the flux of radiant energy escaping Earth’s atmosphere hinders Earth’s cooling, which incrementally elevates Earth’s equilibrium temperature. Scientists refer to such flux changes as radiative forcing.[9]
However, scientific research now demonstrates that the greenhouse effect is saturated at the current level of atmospheric concentration of GHGs, and higher. The following paragraphs explain.
The Saturated Greenhouse Effect
A scientific publication by two distinguished physicists (Van Wijngaarden[10] and Happer[11] 2020) reported how the authors calculated that a 100% increase in the concentration of CO2 and CH4 in the atmosphere will only cause a marginal increase in the radiative forcing of global temperature.
The authors obtained this result using the well-proven Schwarzschild[12] equation to calculate the flux of Earth’s radiant energy escaping to outer space for specified concentrations of GHGs in the atmosphere. The calculations used HITRAN[13] – a database of high-resolution spectrographic data that quantifies how gas molecules in the atmosphere absorb and emit radiant energy. The Schwarzschild equations were solved using the HITRAN data for the five most significant GHGs. The authors solved the Schwarzschild equations for each discrete spectral line (discrete frequency) in the spectrum of Earth’s radiant infrared energy as described by the HITRAN database for each of the five GHG molecules. Solutions were combined to form a computerized line-by-line mathematical model that calculates Earth’s cooling radiant flux and radiant intensity at the outer edge of Earth’s atmosphere for several simulated atmospheric concentrations of the five GHGs.
The authors calculated the radiant flux for each of the five GHGs at current atmospheric concentrations and also at a 100% increase of (or double) the current concentrations. The differences in flux between the two simulations are equivalent to simulated radiative forcings (flux changes) caused by doubling the atmospheric concentrations. The simulated radiative forcings are tabulated below. These simulations assume a clear, cloudless sky.
Table 1.
Radiative Forcing of GHGs Due to a 100% Increase in Atmospheric Concentration
| Greenhouse Gas | H2O | CO2 | O3 | N2O | CH4 |
| Radiative Forcing W/m2 | 0.67 | 2.97 | 0.33 | 1.09 | 0.74 |
| Percent of 277 W/m2 | 2.9% | 1.1% | 0.9% | 0.4% | 0.3% |
The radiative forcings listed in the middle row of Table 1 were copied from Table 3 of the authors’ publication. To provide perspective, this brief has also expressed the calculated radiative forcings as a percentage of the calculated average flux at the top of the atmosphere – 277 W/m2. The small percentages of radiative forcing caused by a simulated 100% increase in atmospheric concentrations demonstrate that the greenhouse effect is saturated at current levels of atmospheric concentrations of GHGs, and higher.
Figure 2 plots the simulated flux of Earth’s cooling for each frequency in the Earth’s radiation spectrum at the outer edge of Earth’s atmosphere.[14] The simulations plotted by the authors include four different atmospheric concentrations of CO2 listed in the legend. The “Area” annotations represent the sum of the radiant fluxes across all of the frequencies plotted. The blue “transparent atmosphere” plot simulates the radiant flux without any GHGs in Earth’s atmosphere. The simulated radiative forcing caused by doubling atmospheric CO2, from 400 to 800 ppm, is 3 W/m2 – the difference between 277 W/m2 and 274 W/m2 respectively.
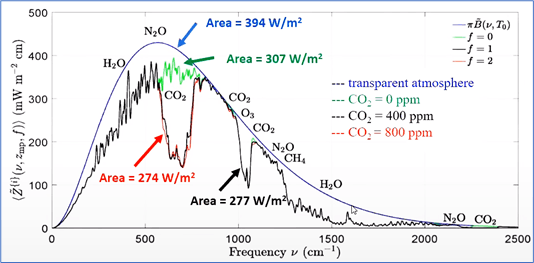
Figure 2. Simulated infrared radiation escaping Earth to outer space.
Confirmed by Other Scientists
Readers should know that the saturation of the greenhouse effect is not very controversial among scientists. The saturation was demonstrated in previous scientific publications. W.D. Collins et al (Collins et al 2006) published the results of their line-by-line model. Van Wijngaarden and Happer reported in Table 3 that the Collins et al line-by-line model calculated the radiative forcings for CO2 and CH4 to be 2.8 and 0.6 W/m2 respectively. The Van Wijngaarden and Happer results, using the latest HITRAN data fifteen years later, are slightly higher.
The saturation of the greenhouse effect is also demonstrated in Figure 3, a plot of the radiative forcing of five GHGs versus the atmospheric concentration of the five GHGs expressed as multiples of the concentration at the time of the calculation (expressed as 1 on the horizontal axis). Figure 3 is a copy of Van Wijngaarden and Happer’s Figure 6 (a).
The CO2 plot in Figure 3 is also confirmed by a similar plot in Figure 4 published in 2013 by another pair of scientists (Zhong and Haigh 2013). Figure 4 is a copy of Zhong and Haigh’s Figure 6 (a). Their CO2 forcing results are similar to Van Wijngaarden and Happer’s plot at around 400 ppm and 800 ppm (multiples 1 and 2 in Figure 3). Zhong and Haigh extended their calculations for CO2 to a second doubling (≈1600 ppm).
Confirmation by Observation
Van Wijngaarden and Happer did not have measurements of the radiant flux escaping Earth’s atmosphere available to compare to their simulated radiant fluxes. However, they also used their Schwarzschild – HITRAN model to simulate the closely related radiant intensity[15] at the edge of the atmosphere and then compare the calculations to intensities measured by a spectrometer located in an Earth satellite.
Figure 3. Radiative Forcing vs. GHG concentration by van Wijngaarden and Happer.
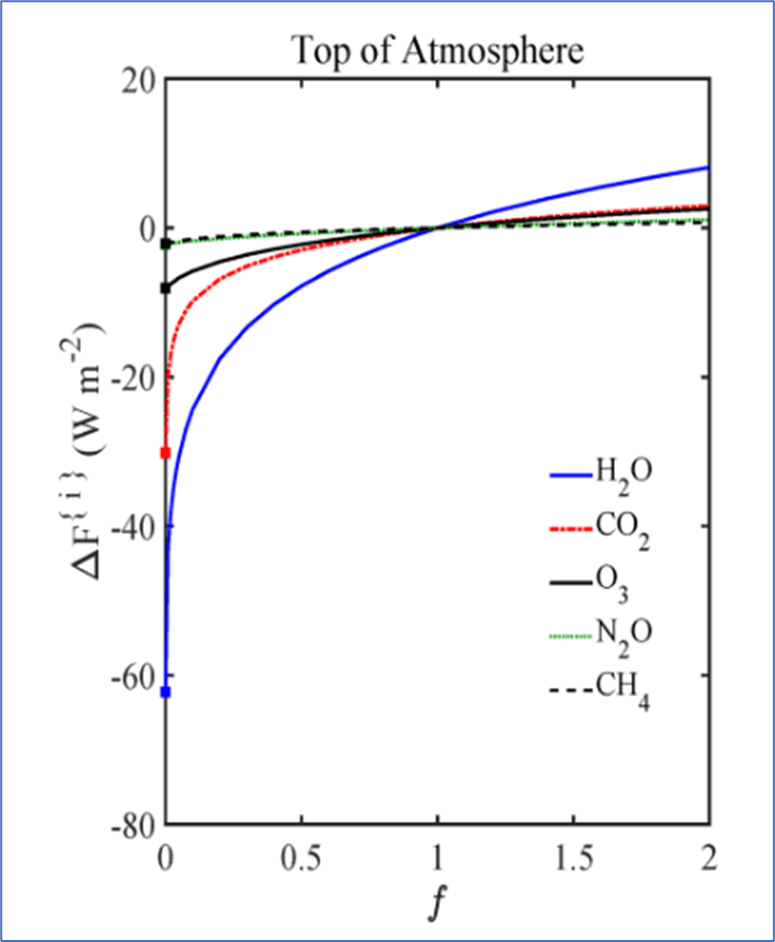
Figure 4. Radiative Forcing vs. CO2 concentration by Zhong and Haig.
The comparisons of model calculations to the satellite measurements were made at three different locations on Earth with widely varying surface temperatures. Figure 5 demonstrates the remarkable agreement of the predictions with satellite observations. Figure 5 was copied from Figure 15 in van Wijngaarden and Happer’s 2020 publication.
Figure 5. Simulated radiant intensities compared to observations.
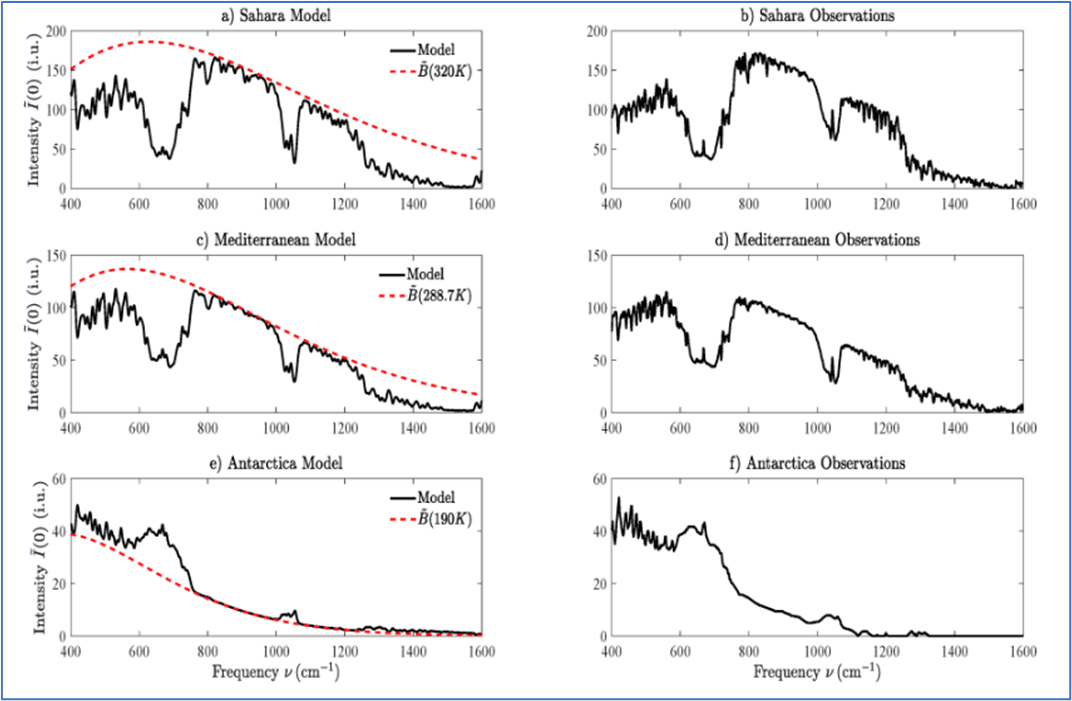
Also, notice how the shape of the radiant flux plot in Figure 2 is similar to the shape of the plot of Mediterranean radiant intensity in Figure 5 (for which the surface temperatures are nearly identical), after allowing for the differences in the vertical and horizontal scales. These agreements provide further confidence in the calculations of the simulated radiant flux of each GHG. The simulation of the fluxes, intensities, and radiative forcings are also credible because they are calculated using the well-proven Schwarzschild formula and HITRAN database. It is also worth noting that the UN IPCC has not explicitly disputed the Van Wijngaarden and Happer 2020 results.
In summary, there is strong evidence that even a 100% increase in the concentration of both CO2 and CH4 gases in the atmosphere will only marginally increase the radiative forcing that causes global warming – only by about 1.1% and 0.3% respectively.
Earth’s Temperature response
Physicists calculate Earth’s temperature for any given radiant flux, by using the well-proven Stefan-Boltzmann law[16] that describes the relationship between the absolute temperature of Earth and the flux of infrared radiation that Earth emits. As plotted in Figure 2 above, the radiant flux escaping the atmosphere was calculated to change from 277 W/m2 to 274 W/m2 when the atmospheric concentration is simulated to increase from 400 to 800 ppm respectively. The Stefan-Boltzmann law (or formula) is expressed as FT = εσT4 or as TF = (F/εσ)1/4, where F = radiant flux (W/m2), T = absolute temperature (°K), ε = Earth’s cloud-free emissivity @ 0.7[17], and σ = 5.67 x 10⁻⁸. (Physicists refer to σ as the Stefan-Boltzmann constant.)
Using the Stefan-Boltzmann formula, the corresponding average global temperature (TF) for the 277 W/m2 flux (F277) is calculated to be 16.03°C. Similarly, the corresponding temperature for the 274 W/m2flux (F274) is calculated to be 15.24°C. So, the global temperature change due to a 100% increase in the atmospheric CO2 is 0.79°C (16.03°C – 15.24°C).[18]
TF = (F/εσ)1/4 = (FT / (0.7*5.67*10^-8))) ^ (1/4) in Microsoft Excel format to solve in Excel.
T277 = (277/ (0.7*5.67*(10^-8))) ^ (1/4) = 289.03 °K = 16.03°C
T274 = (274/ (0.7*5.67*(10^-8))) ^ (1/4) = 288.24 °K = 15.24°C
Temperature change = T277 – T274 = 0.79 °K = 0.79°C
Similarly, the global temperature change due to a 100% increase in the atmospheric concentration of CH4 is calculated to be 0.19°C. We can round these two calculated temperature changes to 0.8°C and 0.2°C for CO2 and CH4 respectively.[19]
These specific temperature change calculations cannot be confirmed by observation because other phenomena (identified in the section that follows) can change the global temperature by amounts that are unknown at the present state of climate science. Nevertheless, these calculations are credible because both the Schwarzschild and Stefan-Boltzmann formulas have been confirmed in many ways and used for well over a century without having been disproved by observations.
Even so, the temperature calculations above include some uncertainty. For example, the calculations assume a cloud-free sky. Clouds reduce Earth’s temperature by a varying and uncertain amount. The emissivity is an estimate and is also subject to variability, thus introducing additional uncertainty. Nevertheless, these temperature calculations are reasonable and useful estimates that reflect that the marginal greenhouse radiative forcing is likely to cause only marginal changes in global temperatures.
Natural Warming and Cooling
Earth warmed by about 0.7°C (Climate.NASA.gov 2024) during the 20th century while the atmospheric concentration of CO2 rose by only about 25% (Betts 2021). Yet, 0.7°C is close to the calculated warming for a 100% increase in atmospheric CO2. This implies that there was an additional cause for 20th-century global warming.
Figure 6. Rising emissions, cooling temperatures.
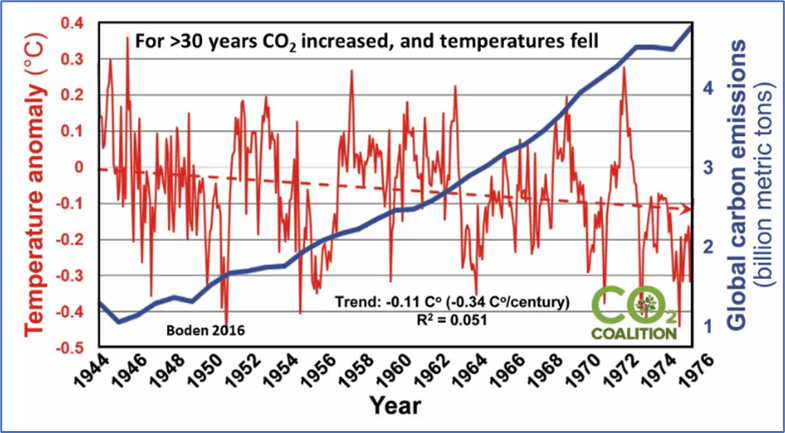
Also, as Figure 6 shows,[20] even when CO2 emissions quadrupled from 1945 to 1975, the Earth stopped warming and slightly cooled (Climate Facts 2024). Some scientists famously speculated at the time that a new ice age might be beginning. Since the evidence previously cited so strongly supports the saturated greenhouse temperature calculations, the slight cooling implies that other natural phenomena stopped warming or allowed the Earth to cool for three decades during the 20th century.
Scientists have identified several non-human-caused (natural) phenomena that have warmed and cooled Earth in the past and seem likely to do so in the future. For example, there have been four well-documented glacial (ice age) periods followed by inter-glacial warming periods in the distant past. The duration of each glacial/interglacial period extends about 100,000 years. Considerable evidence has been discovered by astrophysicists that glacial and interglacial periods are caused by very long-term cyclical changes in Earth’s motions relative to the sun. At present, Earth may be near the end of the last interglacial warming cycle or the beginning of the next cooling cycle.
There have also been other long-term warming periods such as the Medieval Warm Period, extending seven to eleven centuries ago, when Vikings established farms in Greenland and agriculture flourished all over Northern Europe. That was followed by a cooling period about four centuries ago called the Maunder Minimum. These warming and cooling cycles were more moderate than glacial-interglacial cycles.
There is also evidence that cyclical changes in solar intensity are the cause of moderate cyclical warming and cooling of Earth. Some astrophysicists predict that Earth will enter a new cooling period for a few decades around the year 2030. They call it a grand solar minimum. There is also evidence that solar intensity variations affect cosmic radiation from the stars which may affect Earth’s cloud cover. Cloud cover has a well-known, powerful effect on Earth’s temperature.
There are also shorter-term temperature cycles attributed to major ocean currents. For example, many scientists and meteorologists believe that we are now (in 2024) experiencing a spike in warming that scientists attribute to the El Nino current in the Pacific Ocean. El Nino is the warming part of a natural warming and cooling cycle that scientists call the Southern Oscillation.
In the interest of brevity, natural variabilities have not been documented in this brief as none of the phenomena mentioned here have been sufficiently quantified and confirmed by scientific methods such that associated temperature or climate can be reasonably predicted. However, interested readers can readily explore the science of natural variabilities on the websites of Wikipedia, NASA, NOAA, Friends of Science, and the CO2 Coalition for relevant documents, many of which are written for non-scientists.
Warming and Cooling by Feedback
Some scientists hypothesize that positive feedback will amplify small increments of greenhouse warming. Positive feedback is hypothesized to be atmospheric reactions to the instantaneous increases in temperature caused by small GHG radiative forcing. Some scientists attribute positive feedback warming to rising GHG concentrations because the feedback is hypothesized to be triggered by incremental greenhouse warming. Positive feedback hypotheses were reportedly used in constructing the now disproved CMIP6 climate models.
Numerous scientific studies have correlated observed changes in global temperature to changes in the atmospheric concentration of CO2. Climate scientists refer to this correlation as climate sensitivity. Climate sensitivity correlations with observed data vary but generally indicate that the temperature change can range from about 1.2 to 2.0 times the calculated changes attributed to the greenhouse effect. However, correlations do not prove cause and effect, e.g. that greenhouse warming is amplified by positive feedback. The correlations do not rule out natural causes of warming and cooling unrelated to CO2 greenhouse warming.
Positive feedback hypotheses are contradicted by Le Chatelier’s Principle.[21] That principle predicts that changes in the temperature, pressure, or concentration of a physical or chemical system in equilibrium will tend to be minimized by reactions in the system. By this principle, the instantaneous warming caused by the saturated greenhouse effect would be expected to trigger a counter-reaction, negative feedback, that impedes greenhouse warming, rather than positive feedback that amplifies greenhouse warming. However, explosive chemical reactions are an exception to Le Chatelier’s Principle which has otherwise been continually confirmed by experiments and chemical processes since it was first published in 1888.
In any case, neither negative nor positive feedback hypotheses have been confirmed by scientific methods. So, feedback remains controversial and inappropriate to use for energy policy purposes. Unless scientists find a way to confirm the validity of hypothetical feedback, temperature predictions based on positive or negative feedback should be considered with caution.
Summary: Predicting Future Global Temperatures
During the 20th century, global warming exceeded the calculated warming by the greenhouse effect. However, science has not yet progressed to the point that future warming and cooling by natural causes or feedback reactions to greenhouse warming can be predicted. On the other hand, there is considerable evidence that greenhouse warming caused by increases in atmospheric GHGs can be reasonably estimated, at least to the extent that changes in the atmospheric concentrations of GHGs attributed to global warming can be specified or predicted. That means that the effect of restricting GHG emissions can be reasonably estimated.
Eliminating CH4 Emissions
Natural gas and liquified natural gas (LNG) mostly consist of CH4. They are the cleanest, safest, and most efficient sources of fossil energy for space and water heating, cooking, and electric power generation. Yet the US government recently suspended new exports of LNG, reportedly in response to a report that estimated that the CH4 that escapes to the atmosphere from the production, transportation, and storage of LNG is excessive. Climate activists also demand that farmers and ranchers eliminate or capture CH4 emissions from their cattle – activities that are certain to negatively impact the availability and cost of milk and animal protein, plus triggering vigorous farmer and consumer protests. Another significant global human source of atmospheric CH4 is rice farming.
We now know that CH4 only adds about 0.2°C to global temperature after a 100% increase in the atmospheric concentration of CH4. However, NASA CH4 Concentrations (NASA 2023) reports that only about 60% of global CH4 emissions derive from human activities. As we saw in Table 1, the radiative forcing for a 100% increase in global CH4 emissions is about 0.3 W/m2. The CH4 curve in Figure 3 is approximately linear in the range of doubled CH4 concentrations. So, we can estimate that the forcing for human-caused CH4 emissions to be roughly 0.18 W/m2 (60% of 0.3 W/m2). Applying the Stefan-Boltzmann formula to this forcing estimate, we find that the global warming attributable to human activities is calculated to be roughly 0.1°C whenever CH4 emissions from all sources increase by 100%.
According to NASA’s record of the CH4 concentration, it will take about 254 years[22] for the current concentration of CH4 to increase by 100%. But even if CH4 emissions double by 2100, the temperature increases attributable to CH4 by 2100 will be an insignificant 0.1°C. So, we can reasonably conclude that there is no significant climate benefit to eliminating CH4 emissions, especially considering that the resulting impact on food production would probably be calamitous.
Eliminating CO2 Emissions
The promise of replacing fossil energy with green energy is to eliminate CO2 emissions, thus eliminating the UN’s alleged threat to human well-being. The scientific evidence indicates that the likely result of eliminating all CO2 emissions would be avoiding about a 0.8°C rise in global temperature whenever atmospheric CO2 emissions increase by 100%. However, only about two-thirds of CO2 emissions are attributed to burning fossil fuels (GHG Emission by Sector 2020). Whenever the current atmospheric concentration of CO2 has increased by 100%, we can again use the Figure 3 chart to estimate radiative forcing solely caused by fossil fuel emissions of CO2. Applying the Stefan-Boltzman calculation to the calculated forcing estimates, the temperature response attributable solely to fossil energy is about 0.5°C. So, eliminating the use of fossil fuels globally would reduce global warming by about 0.5°C when the atmospheric concentration of CO2 would otherwise double. Natural warming, of course, would not be affected.
Extreme Weather
For perspective, consider New Yorkers who migrate from New York City to subtropical Miami. In Miami, NYC migrants experience a climate change with temperatures that average 12°C warmer than NYC’s climate. That’s 24 times the 0.5°C warming caused by fossil fuels when global CO2 emissions double. Yet we can observe that the warmer Miami climate is not a significant threat to migrants from cooler climates who take reasonable care to heed extreme weather warnings, use air conditioning, and otherwise adapt. This simple observation should cast serious doubt on claims that climate change is an existential threat to humanity.
The UN reports predict that global warming will increase the intensity and frequency of temperature extremes, heat waves, heavy precipitation, and droughts. Like the temperature prediction, the UN’s climate predictions are largely based on computer models. Therefore, the UN climate predictions are hypotheses that have been modeled but not confirmed by observation.
Fortunately, past weather observations can give us insight into extreme weather responses to warming. The weather evidence is the extreme weather history for periods when scientists have credible records.
Figure 7. Record-high temperatures
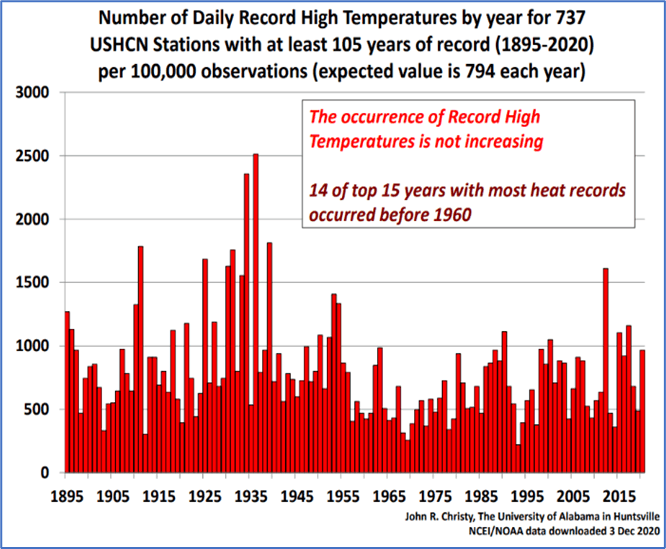
Figure 8. Very wet and dry conditions
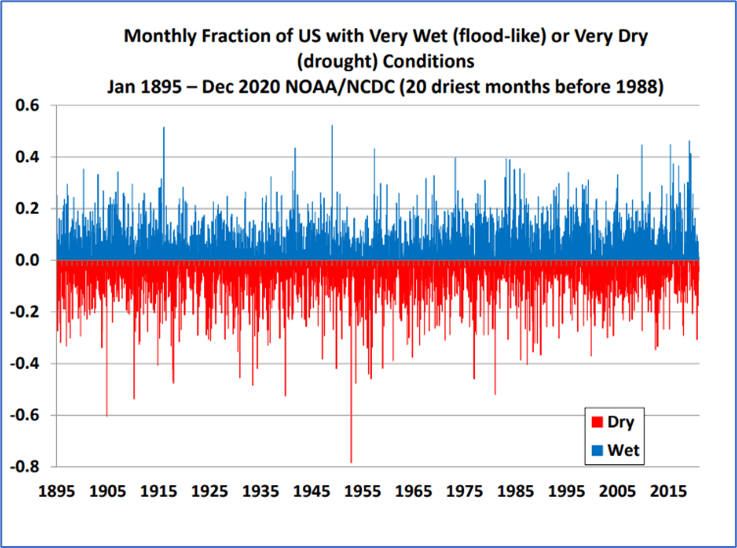
Historical charts of extreme weather in the US since 1895 (Figures 7 and 8) were prepared and presented by Dr. John Christy in a lecture (Christy 2021) from weather records maintained by NOAA. Dr. Christy (who is a PhD-trained meteorologist as well as a climate scientist) advises that the US has reasonably accurate data going back to 1895. Since that time, as the UN and NASA reported, global temperature has risen about 1.07°C. Americans were undoubtedly affected by the extreme weather charted in Figures 7 and 8.
Nevertheless, the charts indicate that there were no rising trends of extremes in record-high temperatures, very wet conditions, and very dry conditions. Dr. Christy’s lecture also included charts that confirm that there has been no uptrend in the frequency and intensity of tornados, hurricanes, and wildfires. We can conclude that the global warming experienced since 1895 has not caused more extreme weather in the US.
Now we can understand that occasional extreme weather events may be unpleasant or destructive, but they are just unfortunate weather extremes, not reflective of climate change or long-term weather trends. And we can realize that the principal cost of extreme weather damage is caused by the existing climate, not a changing climate.
Science Summary
To summarize, this brief has revealed that:
- The UN IPCC’s plain language reports made unsupported claims about increased global warming and weather extremes that have been disproved by distinguished climate scientists who compared the UN’s claims to credible records of past global temperatures and past US weather extremes. The UN IPCC has not explicitly disputed the comparisons.
- The line-by-line radiant energy transfer model developed by Van Wijngaarden and Happer very credibly demonstrates that massive increases in the concentrations of atmospheric GHGs will have only a marginal effect on the radiative forcing that causes global warming. At least two prior studies by scientists yielded similar results. The model’s radiation intensity simulations at the top of the atmosphere are also confirmed by the scientific method, e. comparing remarkably well with satellite observations. The saturation of the greenhouse effect is not disputed by the UN IPCC.
- The effect of eliminating human-caused CH4 emissions on global warming is calculated in this brief using the Stefan-Boltzman formula to be negligible.
- The effect of eliminating CO2 emissions from fossil fuels globally, when the atmospheric CO2 concentrations would otherwise increase by 100%, is calculated in this brief to be marginal, e. about 0.5°C.
- Predictions of global warming caused by positive feedback in response to greenhouse warming have not been confirmed by observations.
- Significant warming and cooling may be caused by natural climate processes. Currently, natural warming and cooling cannot be convincingly quantified or predicted, and cannot be curtailed by eliminating fossil energy consumption.
With this scientific evidence, we can reasonably conclude that the greenhouse effect is effectively saturated such that the global warming and climate change averted by eliminating fossil fuel CO2 will be marginal and that the benefits of eliminating CH4 will be negligible. Other causes of global warming (and cooling) are not yet reasonably predictable.
Using this updated scientific basis as context, we can now examine the likely economic impact of replacing fossil energy with green energy.
Energy Economics
Environmental activists and green energy policy advocates often cite the damage done by recent extreme weather events which they attribute to global warming and climate change. Their claims of economic loss are used to justify the coercive and expensive green energy policies they advocate. So, it would be helpful to have credible estimates of economic losses caused by global warming/climate change compared to credible estimates of the cost of proposed remedies.
The Elusive Cost of Climate Change
Meteorologists and climate scientists cannot distinguish extreme weather events caused by the existing climate, from extreme weather events caused by climate change. Nor can they distinguish between natural or human causes of extreme weather. So, insurance claims and public safety statistics cannot be reasonably classified as originating from existing climate versus changed climate or originating from fossil emissions versus natural causes.
The difficulty of attributing extreme weather damage caused by fossil fuel CO2 emissions casts doubt on predictions of such damage. So, predictions of extreme weather losses solely attributable to future fossil fuel CO2 emissions should be carefully scrutinized for supporting evidence and untested hypotheses.
The evidence previously revealed in this brief indicates that future extreme weather changes solely caused by future fossil fuel CO2 emissions will be marginal. That implies that the resulting damage will be marginal and certainly not catastrophic. However, this hypothesis might never be tested by comparing damage predictions to direct observations of damage that have been credibly demonstrated to be solely attributed to fossil fuel CO2 emissions.
Green Electrification
The US government and a dozen or so state governments are pursuing an energy policy of green electrification. A fundamental component of green electrification is completely replacing fossil-fueled electric generation with wind and solar generation. The energy replacements are federally subsidized by tax credits to make wind and solar generation more competitive with fossil generation on local electric grids. Some states also have laws that mandate the phased replacement of fossil-fueled generation with wind and solar generation. And, federal regulators are issuing air quality regulations to force the early retirement of coal-fired generating plants.
A second major component of green electrification is forcing Americans to replace gasoline and diesel-fueled vehicles with electric battery-powered cars and trucks, and eventually construction and farm machines. Electrification advocates hope that battery-powered vehicles will eventually be charged with green electricity, thus eliminating indirect CO2 emissions attributed to charging electric vehicles. To that end, the federal government is subsidizing electric vehicles with tax credits for vehicle buyers and other subsidies for US electric vehicle manufacturers. Regulators are also escalating vehicle fuel efficiency requirements to force manufacturers to completely phase out the sale of new gasoline and diesel-fueled vehicles.
A third major component of green electrification consists of regulation and preferences to eventually lure and force owners of residential, commercial, and industrial buildings to switch their water heating, space heating, and cooking from natural gas or heating oil furnaces and appliances to electric heating and cooking appliances. The regulations, when issued, will force significant costs on consumers as they replace gas and oil-fired furnaces and appliances with electric devices.
Americans must also fund a huge expansion of US electric grid capacity to replace gasoline, diesel, natural gas, and heating oil energy with green electric energy – potentially doubling the current electric generating capacity and even electric transmission and distribution capacity. The huge expansion might be funded with increases in electricity rates to recover the cost of the grid expansions. The value of existing, but prematurely retired, fossil fuel production and delivery infrastructure must be written off as stranded assets – a loss to the owners and the economy.
Wind and Solar Reliability
Wind and solar generation are unreliable because the wind and sunshine are unreliable. The electric output of these wind and solar generators can vary up and down rapidly, without warning, and beyond the control of electric grid operators. The output can even drop to zero unexpectedly.
Equally challenging, wind and solar energy production is seasonal. With shorter days and the sun lower in the sky in winter, solar output will decline by about half of the summer peak in the winter. Wind energy also varies seasonally. Yet, our electricity-dependent society cannot tolerate electricity with daily and seasonal supply constraints. Unreliable electricity will be even more intolerable as the supply of energy shifts from fossil energy to wind and solar electric energy.
So, wind and solar generation need to be 100% backed up by always-available (firm) and controllable (dispatchable) generation. In the US, wind and solar generation are currently backed up by firm and dispatchable generation such as fossil-fueled, nuclear, and hydroelectric turbine generators. As wind and solar generators are added to an electric grid, wind and solar energy can displace part of the fossil MWh energy generated, but cannot reliably displace the MW power to generate, which is required to support grid reliability. Displacing fossil energy reduces fossil fuel costs and CO2 emissions, but not enough to reduce the cost of electricity (as explained below).
Balancing Electric Supply and Demand
Fossil-fueled backup generation must be connected to the grid and typically loaded at around one-third to one-half of the rated MW output or higher so that the fossil-fired turbine generators can respond instantly and precisely to the constant changes in wind and solar output and the changing electric demand. This requirement limits the fuel savings of wind and solar generation and means that electric grids must fund and dispatch duplicate generating capacity. For example, the price of electricity in most of California has tripled over the past two decades, as California electric utilities have steadily acquired wind and solar electricity generation while continuing to rely on existing reliable generation to maintain reliability. European electric grids that have aggressively added wind and solar generation have had similar electricity price experiences.
Failure to maintain the precise and instantaneous balance between electric system demand and generating system output will cause the grid’s protective relays to immediately interrupt the flow of electric power, causing a blackout that protects grid resources. The Federal Energy Regulatory Commission refers to grid operators as “balancing authorities,”[23] reflecting their crucial role of continuously and precisely balancing the electric supply to the constantly varying demand.
In the US, fossil-fueled generation provides about two-thirds of the existing firm and dispatchable generating capacity. If the existing fossil-fueled generation capacity is replaced by non-firm and non-dispatchable wind and solar capacity, the affected grids will transition from very reliable to very unreliable and eventually fail. Since a reliable electricity supply is essential, another form of backup needs to be added to the grid if retiring fossil-generating capacity is not replaced with new fossil-fueled generating capacity.
Zero-carbon Backup for Wind and Solar
Zero-carbon-emissions backup that is firm and dispatchable could include hydro, nuclear, and geothermal generation. However, new suitable hydro sites are rare in the US and nearly impossible to permit in the US because of opposition from environmental activists. Geothermal sites are also rare in the US and may be difficult to permit. Nuclear generation has been effectively outlawed in the US by the Nuclear Regulatory Commission. None of these three firm and dispatchable sources of electricity are being encouraged or significantly expanded in the US at this time.
Storage batteries are often promoted by green energy advocates as a zero-carbon way to back up wind and solar. When charged, they are firm, dispatchable, and probably easier to permit than any energy alternatives. But they are very expensive, and the capacity of battery storage required is massive. The battery capacity dedicated to electric grid backup needs to have MW power capacity that matches retiring fossil-fueled, nuclear, and hydro capacity, plus the capacity expansion required to accommodate the switch to green electrification. In addition, the backup batteries need a MWh energy capacity that will be sufficient to provide electric energy stored during high-output seasons to be released to the grid in low-output seasons.
Professional Engineer Ken Gregory (Gregory 2022) estimated the instant capital cost of green electrification in the US using storage batteries to accommodate capacity expansion and replace existing fossil generation. The estimate is between $214.3 trillion and 240.8 trillion. That’s more than eight or nine times the US GDP and over $1 million per US adult in 2020.
Figure 9. Backup battery storage required to replace US fossil generation.
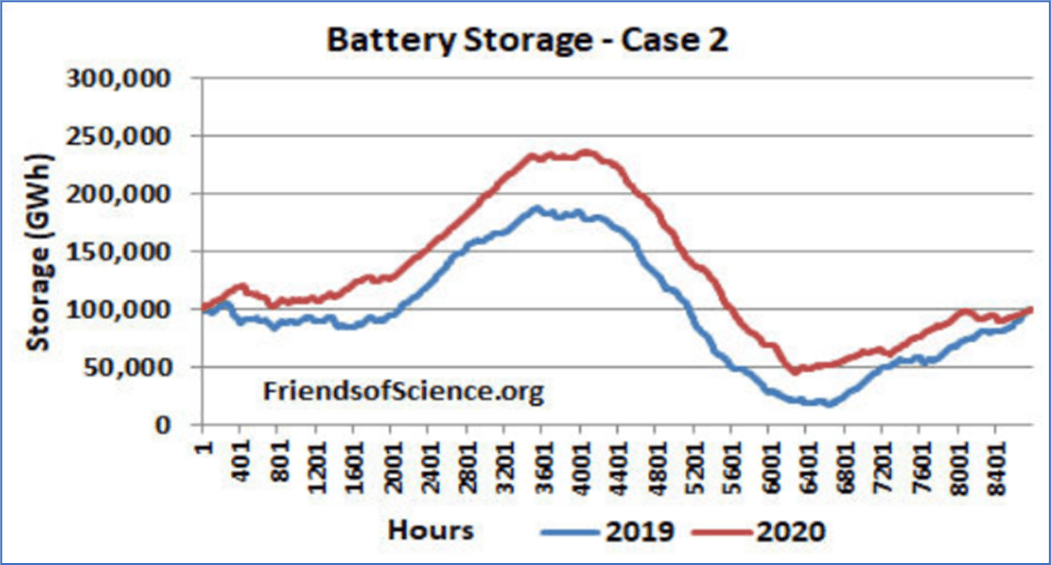
Figure 9 (a copy of Figure 5 in Mr. Gregory’s publication) shows how much electrical energy must be stored in grid batteries for the entire US when wind and solar output are near maximum, to be fully discharged when wind and solar output are near minimum. (200,000 GWh equals 200 billion KWh.)
Mr. Gregory’s estimate is credible because his publication lists all his data assumptions and sources and provides the Excel worksheet model he used to make the cost calculations. That makes it easier for others to critique or improve on his work. However, his simplified cost analysis does not include the cost of construction funding, battery replacement (about $200 trillion in current dollars after about 15 – 20 years), or maintenance. A more complete cost analysis would also include the savings of eliminating fossil fuel expenses (roughly $1 trillion annually) and the maintenance cost of fossil-fueled generating facilities, vehicles, and machines.
Global Cooperation
Preventing increases in atmospheric CO2 requires the cooperation of most of humanity. For three decades, the UN has been campaigning to persuade its 193 member nations to cooperate by sharply curtailing CO2 emissions. The UN has organized more than two dozen high-level global Conferences of Principals (COP), the Kyoto Protocol, and the Paris Agreement.
But, the UN’s campaign to reduce global CO2 emissions has largely failed. Only about 10% of the world’s nations have been reducing CO2 emissions. Some nations make pledges to reduce CO2 emissions in the future but continue to increase their use of fossil energy.
Figure 10. Three decades of the UN campaign against CO2 emissions.
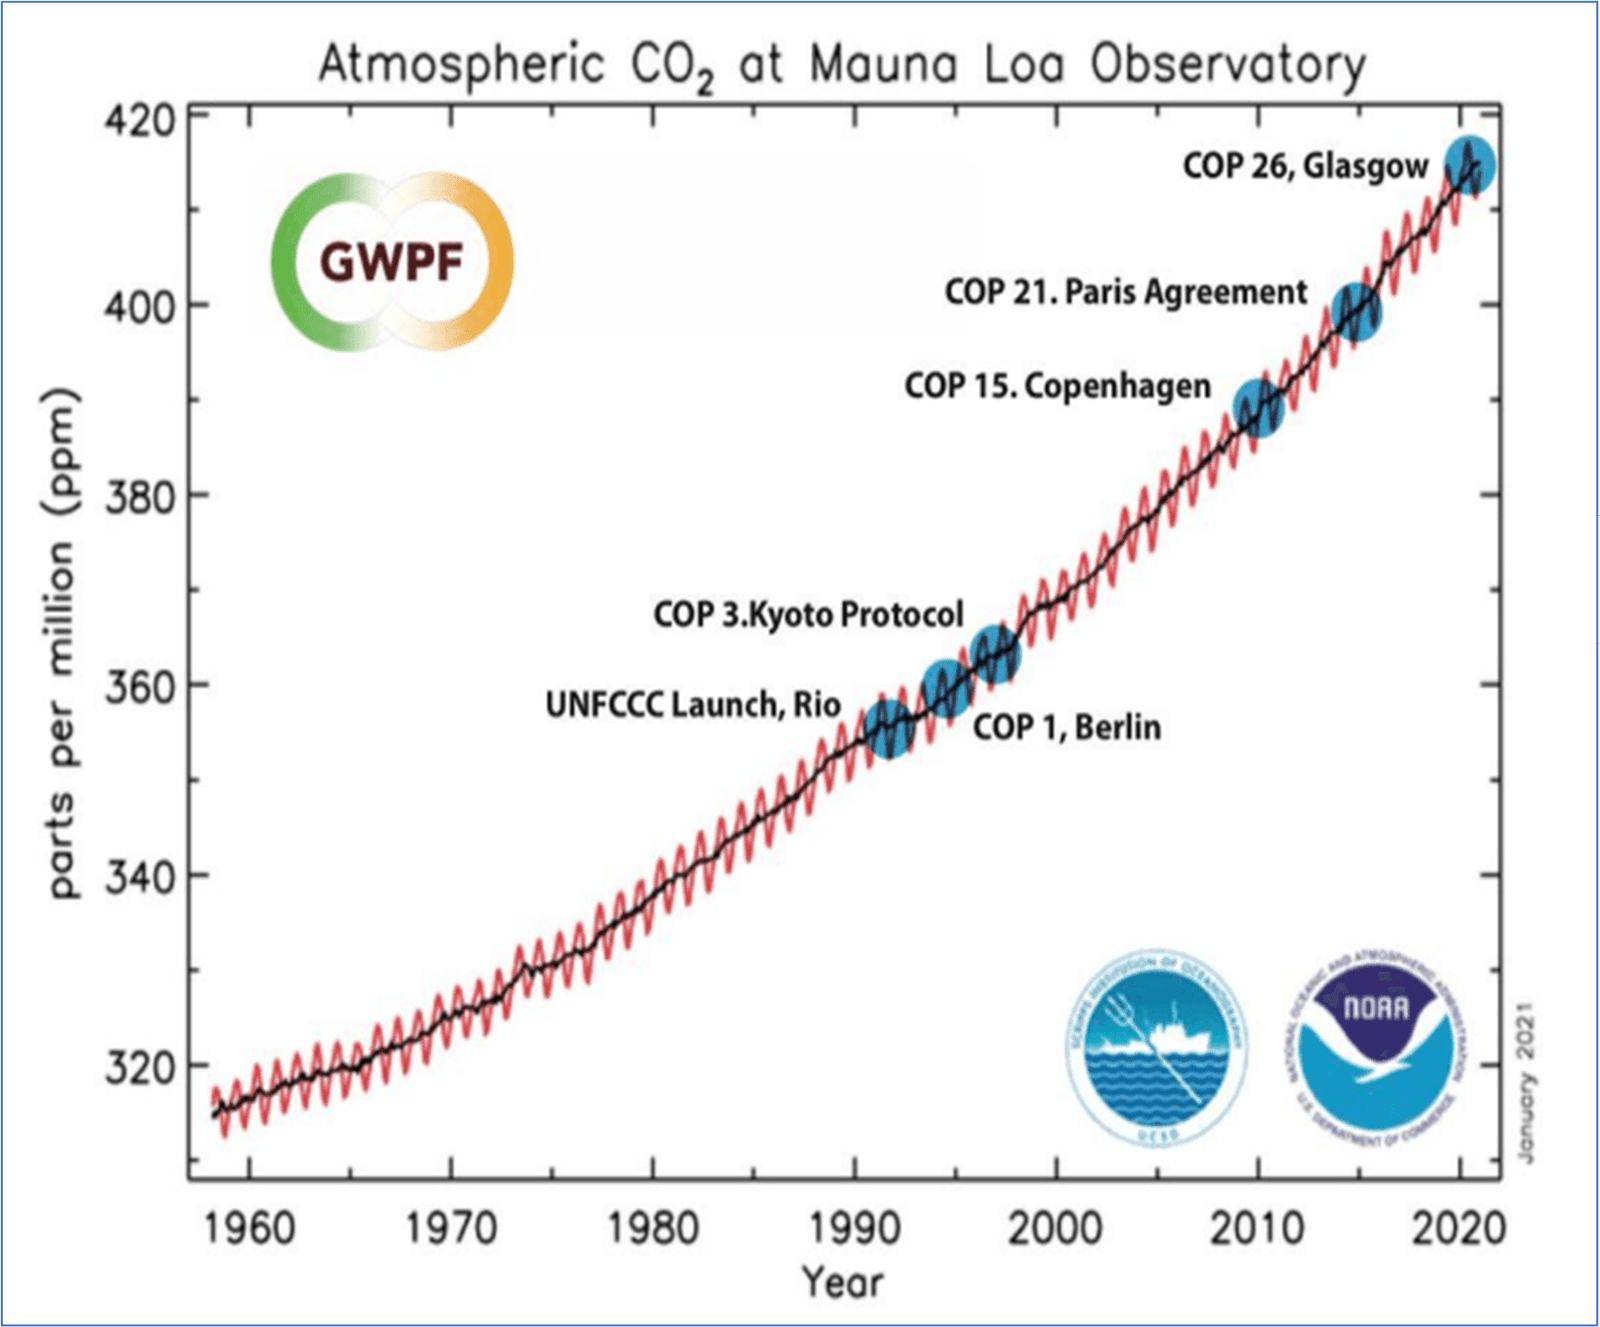
The Figure 10 chart of atmospheric CO2 concentration illustrates the UN’s efforts and its obvious failure to reduce atmospheric CO2 concentrations. The chart was copied from a slide presentation (Christy 2021).[24]
Contrasting Examples for World Consideration: California and China
Some climate activists insist that if Americans are forced to give up fossil energy, the remainder of humanity will follow the example. As it happens, the world already has two useful examples to consider.
California has a law that requires fossil and nuclear generation to be mostly phased out in a decade or so and entirely phased out by 2045. So, California has been making large additions to wind and solar generation capacity without adding much new fossil and nuclear generation capacity for almost two decades. Not surprisingly, California began experiencing blackouts in 2020 and the state’s three energy agencies feared more might occur.
In reaction, the state government reversed the retirement of three large natural gas-fueled generating plants and the pending retirement of a 2100 MW nuclear-generating plant. The California legislature also ordered the development and construction of new fossil-fueled generating plants (up to 5,000 MW) to serve as an emergency electric capacity reserve. (Balaraman 2022)
Noticeably, California resorted to fossil and nuclear generation, instead of installing storage batteries for long-term electric grid backup. Perhaps California legislators were quietly informed of the staggering cost of grid-scale backup batteries. Theoretically, the battery costs can be recovered by raising electricity prices. But even the green-dedicated California officials seem to fear the repercussions of the unbearable rate increases required.
China is the second example. As late as 1970, almost everyone living in China lived in poverty. That’s when the Chinese government licensed modern coal-fired generation technology from US companies and began an unprecedented expansion of coal mining and new coal-fired power generating plants to produce large quantities of affordable electric energy. The Chinese government also initiated a measure of respect for property rights, private enterprise, and a semi-market economy. Fifty years later, hundreds of millions of Chinese have escaped poverty with the considerable help of affordable and plentiful fossil energy; and anyone can observe that China’s standard of living has soared and that there has been no corresponding global uptrend in extreme weather.
According to Statista.com, the price of electricity in China is $0.076/KWh. After California abolished coal-fired generation and acquired huge additions of wind and solar generation, the average price of residential electricity in California has risen to about $0.32/KWh – four times greater than in China. Yet California has not begun to incur the massive cost of replacing its fossil and nuclear generation with backup storage batteries.
China promises to curb its emissions someday. However, China continues expanding its low-cost fossil energy production to grow its wealth and to build up a powerful military. Meanwhile, other nations compromise their wealth production and militaries, to embrace expensive green energy.
Very few nations are likely to be impressed by the example presented by California. Most nations have strong incentives to follow the example presented by China.
If Only the US Eliminates Fossil Energy
What happens if the US replaces fossil energy, and most of humanity does not? The US contribution of fossil-fuel-emitted CO2 is about 13% of the world’s total fossil-fuel-emitted CO2. That means that when the atmospheric concentration of CO2 has increased by 100%, eliminating fossil energy in the US alone will avoid global warming by a negligible 0.1°C.
Commentary
The forgoing report has revealed important facts and logic that serve a better understanding of fossil energy emissions, global warming, climate change, and green electrification. End notes are provided for readers desiring expanded explanations. References are listed below the end notes to assist readers who desire to further verify the facts reported in this brief.
The following paragraphs present the author’s conclusions and comments based on the forgoing revelations and a few additional facts pertinent to the commentary.
Other Green Alternatives
Nuclear, hydro, and geothermal electric generation do not emit CO2. None of these green alternatives are being significantly developed in the US. Nuclear generation has been suppressed by US governments for decades and is effectively outlawed. Hydro and geothermal generation suffer from a lack of suitable sites. So, these alternatives have not been considered in this brief.
The US government is subsidizing other technologies to prevent global warming. The subsidized technologies include biofuels, hydrogen fuel, and the capture and storage of CO2. Biofuels are also supported by government mandates that require blending biofuels with gasoline. The government support measures are prima facie evidence that these alternatives are not competitive with fossil energy. Otherwise, the subsidies and mandates would not be necessary.
Increasing the price of fossil energy to consumers suppresses demand for fossil energy. Price can be increased by taxing fossil energy production or consumption and/or by various means of restricting the supply of fossil fuels. The effect is to suppress the demand for fossil energy when there is no cost-effective alternative. (California is pursuing this manipulated price strategy with the result that California has much higher gasoline and electricity prices than most other states.)
Higher fossil energy prices make individuals and businesses poorer and less productive. Higher prices also encourage businesses to move their energy-consuming production to less costly jurisdictions, thus exporting the associated wealth production and employment opportunities.
Now that we know that fossil fuel emissions are a minor threat, government support for these costly alternatives cannot be reasonably justified. That’s why the above alternatives are not analyzed in this brief. That said, humanity will undoubtedly benefit when alternative energy technologies are allowed to emerge, and they are cost-effective without the support of government subsidies and mandates.
Climate Adaptation
Climate adaptation might be more cost-effective than any of the climate remedies outlined above. Adaptation essentially means that people and their governments do what humans have always done – learn how to safely coexist with the extreme weather that comes their way. Consider, for example, that world public health and safety records indicate that human deaths attributable to extreme weather declined by 90% between 1920 and 2010 (Goklany 2011). That decline can only be attributed to human adaptation – greatly aided by the growing wealth of Earth’s human population (which was considerably aided by an abundant supply of affordable energy).
Adapting to Rising Seas
Scientific research indicates that Earth’s global average sea levels have been rising for centuries, long before the era of human-caused carbon emissions. Global warming undoubtedly increases sea levels, but because of the complexity of Earth’s atmosphere and oceans, the timing and rate of increase of rising seas are not very well correlated to global warming.
According to the UN reports, the global mean sea level increased by an average of 0.2 meters (7.9 inches) between 1901 and 2018, when the Earth warmed by about 1.07°C. High tide levels at some locales rose higher and some fell lower. Obviously, people should consider future sea levels in deciding where to buy or build structures near a seashore. Seashore property owners can rebuild existing structures on higher ground or a bit farther from the future seashore when it is time to replace aging structures. So, it seems unlikely that the rising sea levels will be damaging many structures much before the end of their useful lives. The loss of investment in land below future tides seems to be the most significant economic threat of rising seas. Abandoning fossil energy will not prevent land losses, but Dutch-style dykes might be cost-effective in some locales.
Adapting to Extreme Weather
Consider the concern of some Californians that climate change will increase the danger of California wildfires, threaten California’s already strained water supply, or increase the frequency and severity of flooding caused by Pacific Ocean storms. If those concerns are truly a threat, then California’s strategy of replacing fossil fuels to thwart climate change in California is risky, because it is rendered useless by the saturation of greenhouse warming and because it depends on the unlikely cooperation of other US states and other nations. Fortunately, California has self-sufficient adaptation options to protect residents from these concerns.
For example, damage from wildfires can be mitigated by routinely and regularly clearing potential wildfire fuel from firebreaks that separate potential burn areas from habitats, structures, and electric power facilities. Dead trees can be routinely removed from forests. Areas around electric power lines that traverse potential burn areas can be kept clear of potential wildfire fuel or the power lines can be placed underground.
Similarly, California can expand existing civil structures to better control flooding and even capture more stormwater and mountain snowmelt runoff in expanded reservoir capacity. Desalination facilities along California’s very long coastline could provide another way to expand the water supply. Water consumption can be better allocated and conserved by establishing a free market system for water supply and pricing. When new port facilities are being planned, plans can be adjusted for the expected future change in high and low tides.
Even if the feared climate changes fail to significantly occur at any time in this century, Californians will benefit from these adaptations because they will protect them from the significant threats of extreme weather from the climate that already exists. And, if increases in extreme weather do emerge, California will not be dependent upon the rest of the world to bear costs that other states or nations are unwilling to bear to save California from increasingly severe weather.
Although adaptations can be expensive, rigorous cost-effectiveness analyses are likely to prove that specific adaptations will be much less expensive and disruptive than California’s current agenda of green electrification. And, because the greenhouse effect is saturated, only a fraction of the cost of adaptation should properly be attributed to additional fossil-fueled CO2 emissions.
Appropriate adaptations will vary depending on the locale. For example, Arizona might focus on providing very low-cost electricity to operate air conditioning and irrigation pumping. Kansas might focus on tornado and severe weather warning systems, shelters, and building designs that resist tornado damage. Coastal cities might focus on predicting future high tide marks and identifying future tidal flood zones that should be considered when evaluating plans for community protection or development. The federal government might focus on energy security and policies that allow energy companies to freely compete to supply cost-effective energy to Americans.
Caveat Emptor
Americans have long had access to abundant, reliable, and affordable supplies of energy. So, it is easy for Americans to take energy for granted. But readers might take a moment to imagine what life would be like if we lost access to affordable supplies of gasoline and electricity. Our supplies of water, food, medical care, transportation, jobs, etc. heavily depend on energy. Without energy, most Americans will soon perish. Make energy less reliable and affordable and we will suffer.
Efforts to restrict or eliminate a form of energy are typically based on claims that the energy is unsafe or unhealthy. Yet all forms of energy have health and safety considerations. This means that all forms of energy will eventually be restricted or eliminated unless we understand that we must have energy and that we need to identify the most cost-effective form of energy after taking reasonable measures to minimize health and safety risks. But, the risk of no energy is unthinkable.
Energy is too important to casually accept policies that tamper with our supply of energy. That’s why laws and regulations that interfere with our supply of energy should be cautiously and thoroughly evaluated for benefits, costs, and risks. Furthermore, we must not accept policies that are justified by claims unsupported by evidence – especially when the policies are coercive or costly.
It is risky and irresponsible to enforce any energy policy that reduces energy affordability and accessibility without a thorough evaluation of the policy, including the evidence. And, if we don’t insist on credible evidence, we can be led to believe almost anything. So, no evidence? Flimsy evidence? Caveat emptor – buyer beware.
Conclusions
The following are five key conclusions drawn from the information disclosed in this brief.
- The warming avoided by replacing fossil energy with green electrification is marginal at best. Scientists have demonstrated that the greenhouse warming effect is saturated. Warming caused by fossil-fueled CO2 emissions will be marginal and warming caused by CH4 emissions will be negligible. These findings are credibly supported by the published work of at least three different teams of scientists, by comparison of calculations of energy transfer to observations by satellite, and by well-established principles of physics. Climate models sponsored by UN organizations and the US DOE have been disproved by scientists. Conceivably, greenhouse warming may stimulate warming or cooling by positive or negative feedback reactions, but such hypotheses remain unconfirmed by scientific methods.
- CO2 and CH4 emissions by fossil fuels are not a significant threat to human prosperity and safety. The saturated greenhouse effect, the human experience of traveling from colder to warmer climates, and the US weather records since 1890, are strong evidence that the marginal global warming caused by CO2 and CH4 emissions is unlikely to significantly increase extreme weather or the associated damage to property and public safety. UN claims of a human-caused climate crisis have not been validated by scientific methods.
- Green electrification will lead to an unreliable supply of electricity, intolerable costs, and inconvenience. Wind and solar generation is very unreliable but is currently backed up by fossil, hydro, and nuclear generation. Retiring our existing fossil generation without replacement firm backup will cause electric grids to become unreliable and eventually fail altogether. The unbearable cost of installing electric storage batteries to replace fossil generation as backup (over $1 million per US adult) is the herd of elephants in the room that public officials and green electrification advocates are not publicly acknowledging.
- Replacing fossil energy will be doubly futile. Considering the forgoing conclusions, American sacrifices to eliminate fossil energy without deploying cost-effective energy alternatives will be futile. And considering that most of the world continues to increase its reliance on fossil energy, America’s sacrifices will be doubly futile.
- Adaptation has proven to be increasingly reliable and effective in protecting Americans from extreme weather. Adaptation has been proven to be effective in protecting people from rising seas and extreme weather regardless of the cause. Adaptation does not require abandoning affordable fossil energy or the cooperation of other nations. Adaptations can be focused on specific threats that are unique to each locale. Adaptations can reduce the adverse effects of the existing climate as well as naturally changing That’s why adaptation is probably the best policy to counter the effects of extreme weather.
These conclusions combine to form a compelling case for abandoning the green agenda and continuing to employ adaptation as the preferred strategy to cope with the uncertainties of extreme weather – whether caused by the existing climate, human activities, or natural climate changes.
This is really good news for Americans and all of humanity. Everyone needs to understand that fossil fuels are a minor threat to human health and wealth and that the green agenda is a major threat. Hopefully, a few journalists, commentators, and authors will accept these conclusions and begin to enlighten public officials and the American public about the conclusions listed above.
Notes
[1] The five most important greenhouse gases are water vapor, carbon dioxide, ozone, nitrous oxide, and methane (H2O, CO2, O3, N2O, and CH4 respectively).
[2] Fossil fuels include coal, natural gas, propane, butane, petroleum, and various petroleum refinery products such as gasoline, diesel fuel, and jet fuel. Thousands of non-fuel products are also made from fossil fuels, including chemicals, paints, plastics, synthetic fabrics, cosmetics, pharmaceuticals, and fertilizers for food crops.
[3] “Modelled pathways [scenarios] consistent with the continuation of policies implemented by the end of 2020 lead to global warming of 3.2°C…”
[4] According to the SPM, the mean global temperature of Earth has increased by 1.09°C from 1850 until 2020. This implies a predicted increase in temperature from 2020 until 2100 of 2.1°C (3.2°C – 1.09°C). If CO2 concentration doubles, the UN predictions increase to 3.6°C and 2.5°C (3.6°C – 1.09°C).
[5] Dr. John Christy is the Distinguished Professor of Atmospheric Science at UAH, the Director of the Earth System Science Center, Alabama’s State Climatologist, and a Fellow of the American Meteorological Society. He received NASA’s Medal for Exceptional Scientific Achievement and a Special Award from the American Meteorological Society for his global temperature monitoring work with satellites. https://cigs.canon/uploads/2021/03/f55d365ab8875793d65a0a53207879a2d6e1b20c.pdf
[6] Dr. Roy Spencer was a Senior Scientist for Climate Studies at NASA’s Marshall Space Flight Center in Huntsville. He received NASA’s Medal for Exceptional Scientific Achievement and a Special Award from the American Meteorological Society for his global temperature monitoring work with satellites. He is also the U.S. Science Team leader for NASA’s Advanced Microwave Scanning Radiometer orbiting on NASA’s Aqua satellite. https://en.wikipedia.org/wiki/Roy_Spencer_(meteorologist)
[7] Dr. Richard Feynman’s lecture on the scientific method. Youtube.com https://www.youtube.com/watch?v=EYPapE-3FRw&list=PLyQSN7X0ro23NUN9RYBP5xdBYoiv2_5y2
[8] Dr. Richard Feynman was a professor of physics at Princeton, Cornell, and Caltech. He was awarded the Nobel Prize for physics in 1965. Richard Feynman | Biography, Nobel Prize, Books, & Facts | Britannica
[9] Radiative forcing is the net change in the flux of radiant energy caused by GHGs. It is quantified as power density, i.e. Watts per square meter (W/m2 or W m-2). https://en.wikipedia.org/wiki/Radiative_forcing
[10] William van Wijngaarden is a Professor of Physics at York University in Toronto. He has published over 80 peer-reviewed papers. https://wvanwijngaarden.info.yorku.ca/bio/
[11] William Happer is an Emeritus Professor of physics at Princeton University. He has published over 200 peer-reviewed papers and received numerous awards in the physics profession. Prof. Happer has previously served as Director of Energy Research at the U.S. Department of Energy. He has also served as a science advisor to the US government for years, including a year on the National Security Council. Wikipedia.com. https://en.wikipedia.org/wiki/William_Happer
[12] Scientists use the Schwarzschild equation, published in 1906, to calculate the outward intensity and flux of natural radiant energy transfer from the Earth for any specified surface temperature, frequency and atmospheric concentration of GHGs. https://en.wikipedia.org/wiki/Schwarzschild%27s_equation_for_radiative_transfer
[13] The HITRAN database is a compilation of parameters that scientists use to simulate and analyze the transmission, absorption, and emission of radiation by atmospheric gas molecules. HITRAN is the worldwide standard for calculating or simulating radiant energy transfer in planetary atmospheres. Originally developed by the US Air Force, HITRAN is now maintained and updated by the Harvard-Smithsonian Center for Astrophysics. https://en.wikipedia.org/wiki/HITRAN
[14] This chart was originally published in van Wijngaarden and William Happer’s 2020 work as Figure 4, but without the “Area” annotations and legend. The annotations were added for a lecture by Professor Happer. This chart is copied from the lecture to aid understanding. https://www.youtube.com/watch?v=v2nhssPW77I&ab_channel=InstituteofPublicAffairs
[15] Radiant flux in Figures 2, 3, and 4 is expressed as the radiant power per square meter (Watts per square meter or W/m2). The intensity unit in Figure 5 is the radiant power expressed in intensity units, defined as milliwatts per square meter per solid angle steradians (mW / m2 / sr), for each discrete frequency ( cm-1). Both flux and intensity are expressions of the power (or rate) of energy transfer from matter.
[16] The Stefan–Boltzmann formula mathematically describes the relationship of the flux of thermal radiation emitted by matter to the absolute temperature of the matter. The formula was first derived from observations by Josef Stefan. Shortly thereafter, in 1888, the formula was derived from radiation theory by Ludwig Boltzmann. https://en.wikipedia.org/wiki/Stefan%E2%80%93Boltzmann_law.
[17] In a lecture, Dr. Happer estimated emissivity to be 0.7. The estimate corresponds to a Stefan-Boltzmann temperature calculation that is consistent with Earth’s mean global temperature of about 16°C (61°F). https://www.youtube.com/watch?v=v2nhssPW77I&ab_channel=InstituteofPublicAffairs Further information on emissivity: https://en.wikipedia.org/wiki/Emissivity#cite_note-32
[18] In a lecture, Dr. Happer applied calculus to the Stefan-Boltzmann formula to make a first-order approximation of the temperature response to doubling CO2 to be 0.71°C. https://www.youtube.com/watch?v=v2nhssPW77I&ab_channel=InstituteofPublicAffairs
[19] In 1971, scientists S. I. Rasool and S. H. Schneider estimated the temperature change to be 0.8°C. (Rasool and Schneider 1971)
[20] Figure 6 is a copy of a chart in Fact # 27 on the website of the CO2 Coalition (Climate Facts 2024).
[21] Le Chatelier’s Principle. https://en.wikipedia.org/wiki/Le_Chatelier%27s_principle#:~:text=It%20states%20that%20changes%20in,achieve%20a%20new%20equilibrium%20state.
[22] NASA’s CH4 chart shows the atmospheric concentration of CH4 to be 1932 parts per billion (ppb) and that CH4 concentration increased at the average annual rate of 7.6 ppb. Doubling will increase concentration by another 1932 ppb. So, 1932 ppb / 7.6 ppb per year = 254 years to double concentration at the current rate of CH4 concentration. Methane | Vital Signs – Climate Change: Vital Signs of the Planet (nasa.gov)
[23] Balancing Authority. https://en.wikipedia.org/wiki/Balancing_authority
[24] The chart in Figure 10 was copied from a slide presentation (Christy 2021). The chart was produced by the Scripps Institute of Oceanography and the National Oceanic and Atmospheric Administration (NOAA). The Global Warming Policy Foundation (GWPF) added its logo, and notations of the UN policy conferences and international agreements to the Scripps-NOAA chart.
References
Balaraman, Kavya. 2022. California passed legislation to avoid blackouts and create an ‘insurance policy’ for the grid. Utility Dive. https://www.utilitydive.com/news/california-legislation-newsom-reliability-reserve-fund/626441/
Betts, Richard. 2021. Global CO2 chart created by Met Office. https://www.carbonbrief.org/met-office-atmospheric-co2-now-hitting-50-higher-than-pre-industrial-levels/
Christy, John. 2021. Testing Climate Claims 2021 Update. Irish Climate Science Conference. Youtube.com. https://www.youtube.com/watch?v=ttNg1F7T0Y0
Climate Facts. 2024. CO2 rose after the Second World War, but the temperature fell. Climate Fact # 27 in Climate Facts, CO2 Coalition. https://co2coalition.org/facts/co2-rose-after-the-second-world-war-but-temperature-fell/
Climate.gov. 2024. Climate Change: Atmospheric Carbon Dioxide. Climate.gov https://www.climate.gov/news-features/understanding-climate/climate-change-atmospheric-carbon-dioxide
Climate.NASA.gov. 2024. Climate Change: Vital Signs of the Planet. NASA.gov https://climate.nasa.gov/vital-signs/global-temperature/?intent=121
Collins, W.D. et al. 2006. Radiative forcing by well-mixed greenhouse gases: Estimates from climate models in the Intergovernmental Panel on Climate Change (IPCC) Fourth Assessment Report (AR4). Journal of Geophysical Research: Atmospheres, 111(D14). https://doi.org/10.1029/2005JD006713
eia.gov. 2024. Table 6.07.B. Capacity Factors for Utility Scale Generators Primarily Using Non-Fossil Fuels. Electric Power Monthly. https://www.eia.gov/electricity/monthly/epm_table_grapher.php?t=epmt_6_07_b
GHG Emission by Sector. 2020. GHG Emissions by Sector. Our World in Data. https://ourworldindata.org/ghg-emissions-by-sector
Gregory, Ken. 2022. The Cost of Net Zero Electrification of the U.S.A. Friendsofscience.org. https://friendsofscience.org/pdf-render.html?pdf=assets/documents/Cost-of-Net-Zero-Electrification-of-the-USAv2.pdf
Lee, Hoesung, et al. 2023. Longer Report. Climate Change 2023: Synthesis Report. Contribution of Working Groups I, II and III to the Sixth Assessment Report of the Intergovernmental Panel on Climate Change Cambridge University Press, Cambridge, United Kingdom and New York, NY, USA. https://report.ipcc.ch/ar6syr/pdf/IPCC_AR6_SYR_LongerReport.pdf
Masson-Delmotte, V. et al. 2021. Summary for Policymakers. In: Climate Change 2021: The Physical Science Basis. Contribution of Working Group I to the Sixth Assessment Report of the Intergovernmental Panel on Climate Change. Cambridge University Press, Cambridge, United Kingdom and New York, NY, USA. https://www.ipcc.ch/report/ar6/syr/downloads/report/IPCC_AR6_SYR_SPM.pdf
NASA. 2023. NASA CH4 concentrations. Methane | Vital Signs – Climate Change: Vital Signs of the Planet (nasa.gov)
- I. Rasool and S. H. Schneider. 1971. Atmospheric Carbon Dioxide and Aerosols: Effects of
Large Increases on Global Climate, Science 173, 138-141 https://www.jstor.org/stable/1732207
Shukla, P.R. et al. 2022. Climate Change 2022: Mitigation of Climate Change. Contribution of Working Group III to the Sixth Assessment Report of the Intergovernmental Panel on Climate Change. Cambridge University Press, Cambridge, UK and New York, NY, USA: 379 https://www.ipcc.ch/report/ar6/wg3/downloads/report/IPCC_AR6_WGIII_FullReport.pdf
Van Wijngaarden, William and Happer, William. 2020. Dependence of Earth’s Thermal Radiation on Five Most Abundant Greenhouse Gases. arXiv.org https://arxiv.org/pdf/2006.03098
Zhong, Wenyi and Haigh, Joanna D. 2013. The Greenhouse Effect and Carbon Dioxide. Weather – April 2013, Vol. 68, No. 4. https://courses.seas.harvard.edu/climate/eli/Courses/global-change-debates/Sources/CO2-saturation/more/Zhong-Haigh-2013.pdf