I hate the New York Stock Exchange. I admit it — I hate the place. I always have and I always will. So even though I have no objection to executives earning huge salaries and bonuses, I’ve been positively tickled to see the NYSE dragged through the mud over ex-Chief Executive Dick Grasso’s mammoth pay package.
OK — I’ll wait a moment to rant and rave about that satanic den of sin at the corner of Broad and Wall. First, let’s take a look at a way we can use the NYSE to make some trading profits.
For years the NYSE has published statistics showing the value of its listed shares that have been sold short. (Remember, selling short means selling shares of stock you don’t actually own, in the hope that they will go down so you can make a profit by buying them back cheaper). The NYSE breaks these statistics down into several categories, one of which is the value of shares sold short by the NYSE’s own specialists. (The specialists are a handful of floor traders on the exchange who preside over day-to-day trading, in particular NYSE-listed stocks to which they’re assigned).
The specialists are very active and very sophisticated traders (you’ll learn a lot more about them later when I start to rant and rave). Their short sales always represent a significant fraction of total short sales. Since 1997, specialist short sales have averaged about 40% of the total — they’ve been as high as about 62%, and as low as about 20%. Right now it’s at the low end of the range, at 28.2%.
This percentage is called the NYSE specialist short-sale ratio, and it has been studied by technical market analysts for many years. In fact, it’s such a relic, sometimes today’s traders forget to look at it. That’s a mistake.
Fred Goodman, the dean of technical analysts who writes a daily report on my Web site, has been focusing on the NYSE specialist short-sale ratio lately, and talking about today’s low level in the long-term context of market history. He thinks it’s very bullish for the long term, even though many of his other technical indicators are extremely cautious at the moment.
Fred has determined that the evidence of history shows that the specialists are sharp dudes — and you don’t want to bet against them. When the ratio is low — in other words, when the specialists as a group have only relatively small short positions — the market is more likely to perform well over the long term. But when the ratio is high — and the specialists are holding large short positions — the market could be ready for a drop, and as Fred says, “it was best to be out of the market or net short yourself.”
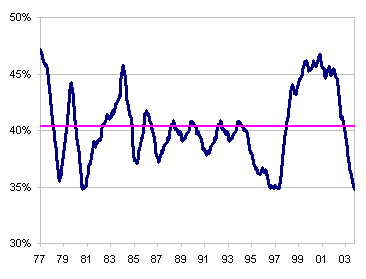
Let’s test it out with real numbers. Using Fred’s long-term data on the NYSE specialist short-sale ratio, I looked at the one-year moving average of the ratio from January 1977 to the present. I used a long-term average to smooth out the short-term volatility in the data. The average reading for the smoothed ratio for that period has been about 40%. Here’s a chart of all the data.
NYSE Specialist Short-Sale Ratio, January 1977 to Present
One-year moving average

Here’s a table that shows one-, two- and three-year returns for the S&P 500 — for the whole period overall, and then broken out by the times that the smoothed NYSE specialist short-sale ratio was either above or below its long-term average. It turns out that Fred was right — in spades. The average returns for the periods when the ratio was below average (when the specialists were less short than usual), were twice as great as the periods when the ratio was above average (when the specialists were more short than usual).
Average Annualized S&P 500 returns, January 1977 to Present
| All Periods | Ratio Above Average | Ratio Below Average | |
| 1 year | 10.1% | 5.7% | 13.7% |
| 2 years (annualized) | 10.2% | 5.3% | 14.0% |
| 3 years (annualized) | 10.8% | 6.8% | 13.6% |
Now let’s put a finer point on it. What if we excluded the times — the majority of times — when the ratio was close to the average, and only look at the rare times when the ratio was at an extreme? Here’s a table that shows the results for those extreme times when the ratio was below 37.5% or above 42.5% — that’s 2.5 percentage points away from the long-term average in both directions. Then the results get even better.
Average Annualized S&P 500 returns, January 1977 to Present
| All Periods | Ratio Above 42.5% | Ratio Below 37.5% | |
| 1year | 10.1% | -0.5% | 16.1% |
| 2years(annualized) | 10.2% | 0.6% | 17.4% |
| 3years(annualized) | 10.8% | 2.0% | 17.1% |
Now look back at the chart showing the smoothed ratio since 1977. You can see that, right now, we’re at an extreme point — and extremely bullish point. But you can also see that this is not a short-term indicator. The exact moments of the extreme lows haven’t been times when the market was immediately poised to explode to the upside. But as the numbers show, from those same points a little bit of patience was richly rewarded.
Now, here’s the ranting and raving (I’ll keep it short).
Just what do you think it is that makes the specialists so smart that over such a long period of time they’ve been so very right on the market — so right that someone like Fred Goodman can use their trading as a technical indicator? Do they simply have bigger brains than the rest of us?
Nope. They’re just ordinary guys and gals (mostly guys), but they have something much better than brains: a monopoly. They don’t have to compete with other market makers like the big Nasdaq traders do. The NYSE specialists have a monopoly on order flow in the stocks of most of the biggest and most important companies in America. They see it all, and they set the prices.
Of course the rationale for the specialist’s monopoly — a myth that Richard Grasso became fabulously wealthy for telling so often and so well — is that the specialist is there to serve the public by providing liquidity and making a fair and orderly market. But in reality, the specialist is like a banker who’ll only make loans to people who don’t need the money. When the chips are down and the public really needs liquidity — like in the crash of 1987 — the specialists run for cover.
Remember the crash of Oct. 19, 1987? That’s when the NYSE became effectively non-operational because orders came in so much faster than their antiquated systems could handle. Richard Grasso — before he became CEO — spent the next two years upgrading those systems. But at the same time, he managed to blame the NYSE’s customers and competitors for causing the crash.
Remember the NYSE’s campaign against “program trading” — large computer-driven trades linked to the index futures markets in Chicago? When Grasso was done lobbying, the NYSE had persuaded the Securities and Exchange Commission to let them impose so-called “circuit breakers” that restrict “program trading” when the market moves by more than a given amount — and shuts down the exchange altogether when the market moves by a really large amount.
What other business — especially one supposedly dedicated to serving the investing public — would plead with its regulators to allow it to restrict its competitors and its own customers — just at those moments when investors need the NYSE the most? It’s like a fire-insurance policy that will gladly pay your claim — just as long as your house doesn’t burn down.
OK — that’s it for the ranting and raving (for now, at least). The good news is that with Grasso’s pay scandal, the NYSE is under more scrutiny than ever.
And maybe it’s even better news that, as long as the NYSE specialists enjoy their monopoly, at least we can use their short-sale data to make a little money ourselves from their unfair advantage.
— First published on SmartMoney.com


