With today’s meeting of the FOMC not likely to generate a lot of surprises, let’s take a moment to look at a chart that offers a remarkable perspective on monetary history. One wants to be careful about taking this kind of analysis too literally, but it is nevertheless quite illuminating.
The chart begins on August 12, 1987, when Alan Greenspan became chairman of the Federal Reserve. The light blue line is the fed funds rate, and the yellow line is the two-year moving average dollar price of gold.
For almost ten years the funds rate tracked the gold price with astonishing precision. Who can really know what was going on in Greenspan’s mind — but by all appearances, he was conducting monetary policy on a “virtual gold standard” or “price rule.” The chart suggests that he was withdrawing liquidity by raising the funds rate when a rising gold price signaled inflationary pressures, and adding liquidity by lowering the funds rate when a falling gold price signaled deflationary pressures.
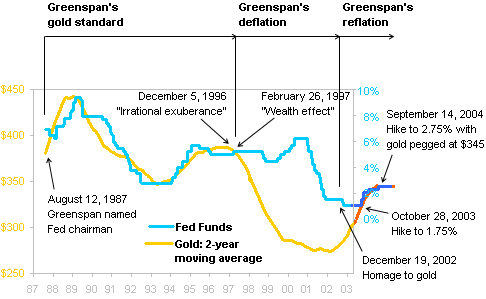
The era of Greenspan’s gold standard ended on February 26, 1997. On that date Greenspan spoke for the first time of the inflationary risk of asset inflation, itself trigged by the “irrational exuberance” he had warned about for the first time two months earlier on December 5, 1996. A month later he hiked the fed funds rate — as gold fell. My colleague David Gitlitz warned then that this signaled the onset of monetary deflation. Over the following five years, commodity prices collapsed, a series of currency and debt crises ensued around the dollar-pegged world. Domestically, heavily indebted capital-intensive companies were ravaged.
Finally, as the measured price indices started flashing zero or even negative rates of change last year, the long-standing monetary deflation became obvious to most economists and market observers. By that time, though, Greenspan’s serial rate cuts had finally had a stabilizing effect and the price of gold began to rise again. On December 19, 2002 Greenspan made the end of deflation official in a speech that began by celebrating the gold standard. The age of reflation had begun.
For just a moment, let’s see where it leads us if we take this all a lot more literally than perhaps it deserves. Gold closed exactly at $345 on December 19 when Greenspan made that speech. Let’s imagine that’s the price that Greenspan has in mind as the target for a new “virtual gold standard” (maybe it’s working — that’s just a few pennies from where gold is at this very moment). If gold were to stay perfectly riveted at $345 from now on, the two-year moving average would finally catch up to the fed funds rate on the chart on just about the date of the October 28, 2003 FOMC meeting. Could that be when the inevitable first rate hike finally occurs?
The moving average dollar price of gold would begin flatlining at exactly $345 on September 14, 2004. By the logic of this chart — for whatever that’s worth — the fed funds rate would be 2.75% then.